Cancer is a complex disease, and developing novel, effective treatments requires testing in preclinical models. Mouse clinical trials represent a critical step in translating promising anti-cancer therapies from bench to bedside. When combined with advanced bioinformatics and analytics tools, mouse clinical trials are a powerful experimental approach to identifying target patient populations, planning cohort extensions, selecting the right combination drug, elucidating the mechanism of resistance, or identifying translational biomarkers [1]. However, conducting a successful mouse clinical trial requires expertise in designing the study, analyzing the data, and interpreting the results. In this blog post, we will guide you through the essential steps of designing a mouse clinical trial and analyzing the resulting data. This guide includes tips on powering the study, preparing the dataset, grouping responders vs non-responders, identifying biomarkers, and integrating proteomics in a multiomics model.
Step 1: Powering the study
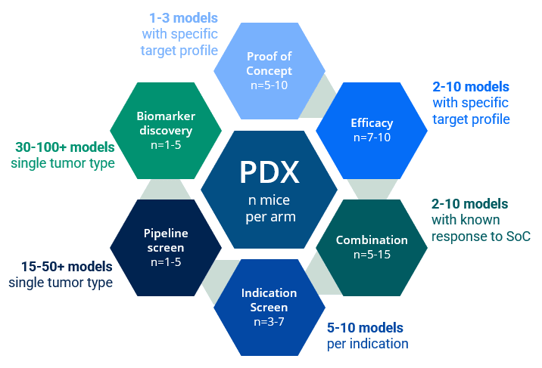
In a mouse clinical trial, animals implanted with PDX models are surrogates of the patients whom PDX models were derived from. Before starting a mouse clinical trial, it is essential to determine the sample size required to achieve reliable and statistically significant results. It is important to enroll a large enough number of PDX models (which corresponds to the number of patients we would enroll) and enough animals per PDX model (so as not to lose a patient if we lose a mouse). Power analysis will estimate the minimum number of animals needed to detect a difference in tumor growth inhibition (TGI) between the treatment and control groups. Typically, researchers set the power at 80% and α at 0.05, which means that there is an 80% probability of detecting a significant difference between the two groups if one exists. It is also recommended to power mouse clinical trials according to the study goal and endpoint. For instance, a survival endpoint may require larger group sizes than a TGI endpoint. If the goal of the mouse clinical trial is to identify a novel biomarker of response, a larger number of models will need to be included in the design.

Step 2: Select models
Model selection is a crucial step when designing a mouse clinical trial and needs to be done by taking into account several parameters associated with the clinical history and molecular characteristics of the models so that the PDX model panel recapitulates the targeted patient population. Tumor indication and/or mechanism of action of the drug are usually the two key parameters that guide PDX model enrollment in a mouse clinical trial, and the deeper the information in terms of clinical classification and molecular profiling the more representative will be the PDX model panel [2]. (Read our blog: "How to Use Metadata as Your Model Selection GPS")
Step 3: Preparing the dataset
Once the study is completed, the next step is to prepare the dataset for analysis. This includes checking for outliers and removing/excluding missing data. One critical factor in analyzing mouse clinical trial data is the identification of PDX models with common response profiles. This is usually evaluated by a modified version of the clinical Response Evaluation Criteria in Solid Tumors (mRECIST). The response rate can be calculated by comparing the tumor volume at day 0 either with the volume corresponding to the best response measured on treatment or with the tumor volume measured on the final day of treatment. The threshold value can vary depending on the tumor type and drug mechanism of action. Therefore, it is crucial to validate the threshold on a panel of known drugs.
Step 4: Grouping responders vs non-responders
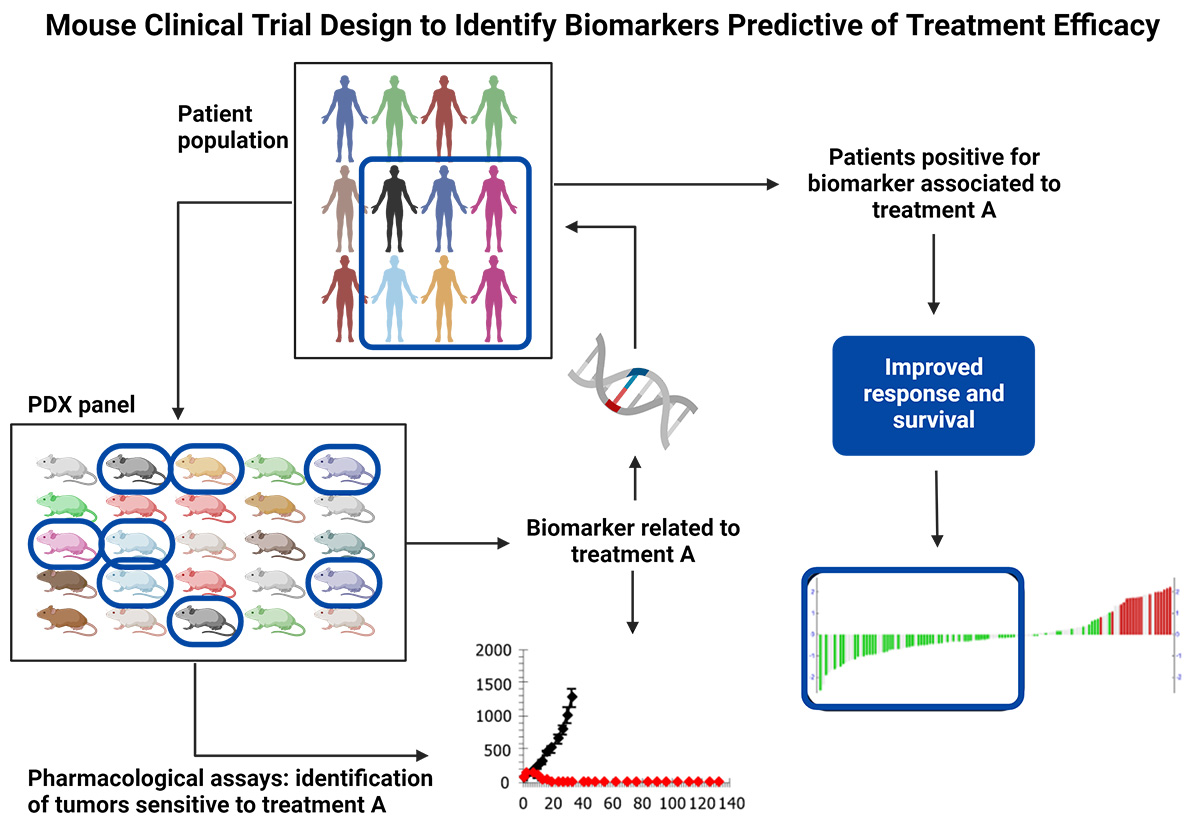
Once the threshold is established, the next step is grouping responders vs non-responders. Responders are mice that show a reduction in tumor volume or mass greater than or equal to the critical value, and non-responders are mice that show tumor reduction below the critical value. These groups are used to compare gene expression profiles and identify potential biomarkers of response [3].
Step 5: Identifying biomarkers
Bioinformatics analysis can be used to identify biomarkers of response. One widely used approach is differential gene expression analysis (DGEA), which compares the gene expression profiles of responders and non-responders to identify genes that are differentially expressed. Another approach is differential gene set enrichment analysis (DGSE), which identifies functional gene sets that are enriched in the responders and non-responders. Partial least-squares (PLS) regression, a dimensional reduction method part of DIABLO multi-omics integration workflow [4], is commonly used to identify the most influential genes within a multi-omics gene network that can predict response. It is very important that mouse clinical trials are designed accordingly when performing multi-omics analysis as an endpoint. (Watch our webinar: "Identify MOA and Companion Biomarkers in Oncology using Multi-Omic Analyses")

Step 6: Integrating proteomics for improved target validation and biomarker identification
Proteomics approaches, such as mass spectrometry-based proteomics, can provide quantitative information on protein expression levels and post-translational modifications. Given the lack of correlation between protein abundance and RNA expression, integration of proteomics and phospho-proteomics data in a multi-omics model can greatly improve the accuracy of therapeutic target expression for model selection, provide a more comprehensive understanding of the molecular mechanisms underlying drug response, and provide an important additional molecular annotation for biomarker identification via single or multi-omics analysis [5]. (Read our blog: "4D Proteomics: Adding Dimension to Protein Detection")
In this blog post, we have provided a step-by-step guide on how to design and analyze a mouse clinical trial, and shown how a successful mouse clinical trial requires careful planning and expertise in bioinformatics. Lumin Acuity offers tailored bioinformatics and computational biology solutions to support your mouse clinical trial planning and data analysis, accelerating decision-making and driving actionable results. Well-designed and executed mouse clinical trials can be instrumental in developing effective cancer therapies and improving patient outcomes.


